We can then choose to execute the program line by line to see if the program does what we want it to do.
You pause the program by setting a breakpoint which is done by clicking in the gutter of the text editor.
A breakpoint is shown as a red dot in the gutter.

To unset the breakpoint click on the red dot.
The program pauses at the breakpoint before executing the line of code at the breakpoint.
In the previous post we traced the path the program takes when a file is loaded.
If we set a breakpoint on a line in that path and then load a file we can have the program pause at that line.
Open TRFile.cpp and set a breakpoint at line 1906.
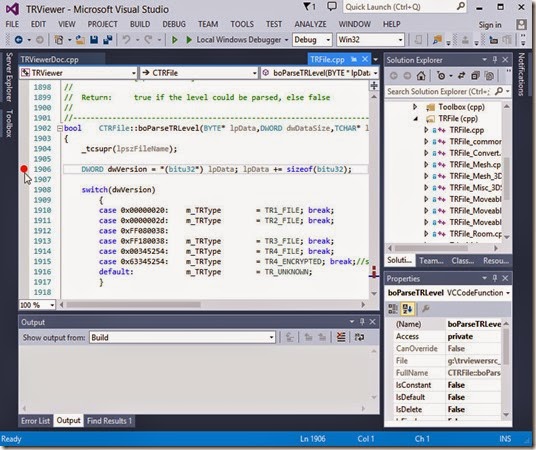
This will pause the program just before it reads the version number of the file.
Run TRViewer using the debugger and open a *.TR4 file.
When running a program in the debugger, have the Stop Debugging button visible so you can stop the program if it “freezes” while debugging.
The program executes all the code before the breakpoint and pauses at the breakpoint.
Notice the yellow arrow inside the red dot of the breakpoint. This indicates the next line of code to be executed.

The program is just about to read the version number and store it in the variable dwVersion.
If you hover the mouse cursor over the text “dwVersion” the current value of dwVersion will pop up.
If you right click on the text “dwVersion” and select “Add Watch” you can add dwVersion to the list of variables displayed in the Watch1 window.
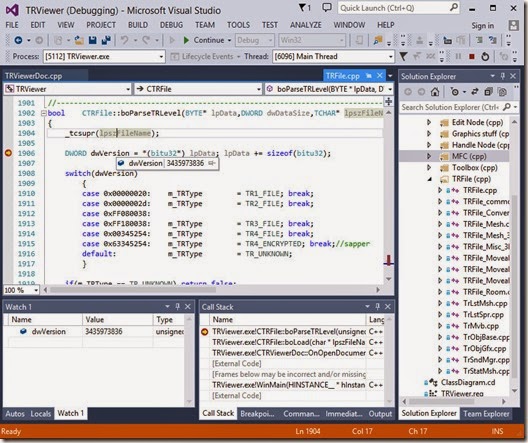
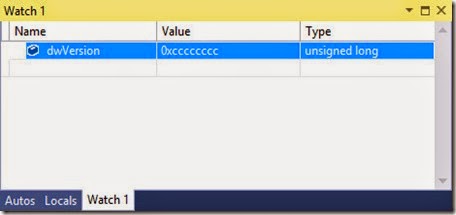
For this variable it makes more sense to view it as a hexadecimal number so right click on dwVersion in the Watch1 window and select “Hexadecimal Display”.
Now to have the program execute line 1906 and then pause again click DEBUG>Step Over or the corresponding Step Over toolbar button.
The yellow arrow moves to the line that will be executed next and the value for dwVersion changes in the Watch1 window to 0x00345254.
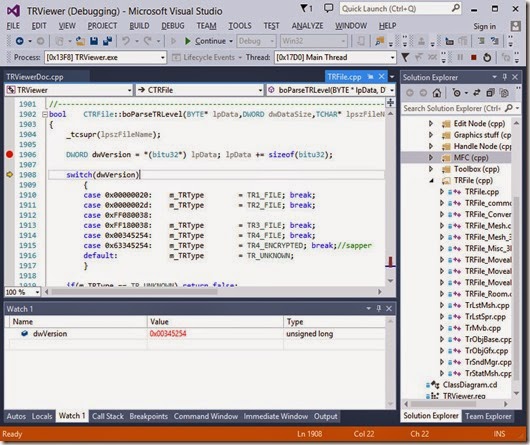
Click Step Over once and the program execution pauses at line 1914.
If you hover the mouse cursor over m_TRType it shows the value is TR_UNKNOWN.
Click Step Over once to execute line 1914 and m_TRType takes the value TR4_File.
You can keep clicking Step Over to see line by line which lines the program is executing.
Step Over repeatedly until the program is paused at line 1944.

Line 1944 calls the vParseTR4File function.
If we Step Over here the program will execute all the code in the function and every function it contains and move to the next line.
If we want to enter the function and step through its code we have to click DEBUG>Step Into.
Click Step Into to enter the function.

Rather than step line by line through the code, place a breakpoint at line 1786 and press DEBUG>Continue so the program will execute all the code and pause at the new breakpoint.
We have paused at a for loop.

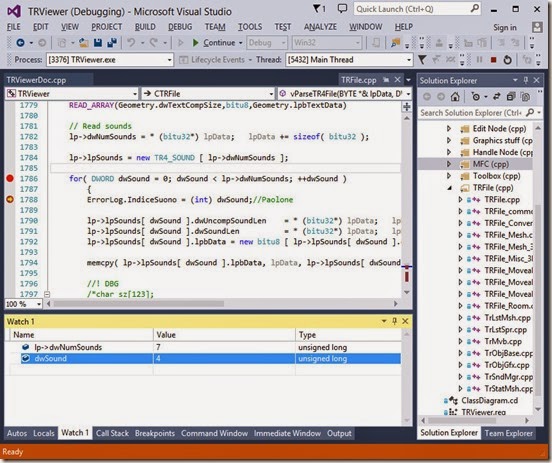
If you check the value of lp->dwNumSounds it is only 7 but some loops repeat hundreds or thousands of times.
If you have no interest in examining the loop, rather than stepping through each iteration of the loop you would set a breakpoint just after the loop and click Continue.
If you are interested in examining the loop but only when it has reached a certain iteration you can set a breakpoint at the first line inside the loop (line 1788) and then right click on it and select Condition.
We will set a condition that pauses the program when the loop is about to start its fifth iteration. You use C/C++ syntax to set the condition so copy the capitalization of any identifiers.
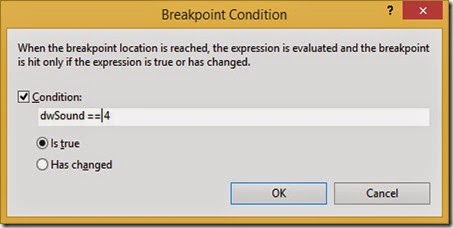
With the condition set click Continue and the program should pause when dwSound is 4.
To execute all the remaining code in the vParseTR4File function and return to the boParseTRlevel function which called it click DEBUG>Step Out.

We return to the line after the call to vParseTR4File and so can now step through the remainder of the boParseTRLevel function if we wish.
We no longer wish to examine the code so click DEBUG>Stop Debugging to halt TRViewer or click continue to run TRViewer and then close it normally.
When debugging you sometimes step into a function accidentally so just click step out to return.
You usually do not want to step into Windows functions or the standard C/C++ library functions or third party library functions.
If you step into a function of a module which doesn’t have debug information or a function you don’t have the source code for then you will most likely see a disassembly window.
Sometimes you can get lost stepping into lots of nested functions and if so just stop debugging and start again.
When debugging a program that crashes you have to reproduce the crash and “Break” at the crash to see which line number was executing when it crashed.
Then you will set a breakpoint in the code before the line, restart the debugger and step through the program, examining the variables with watches to see what went wrong.
This is only been a brief introduction to debugging but hopefully it is a good starting point.
prev | next
No comments:
Post a Comment